← Back to Changelog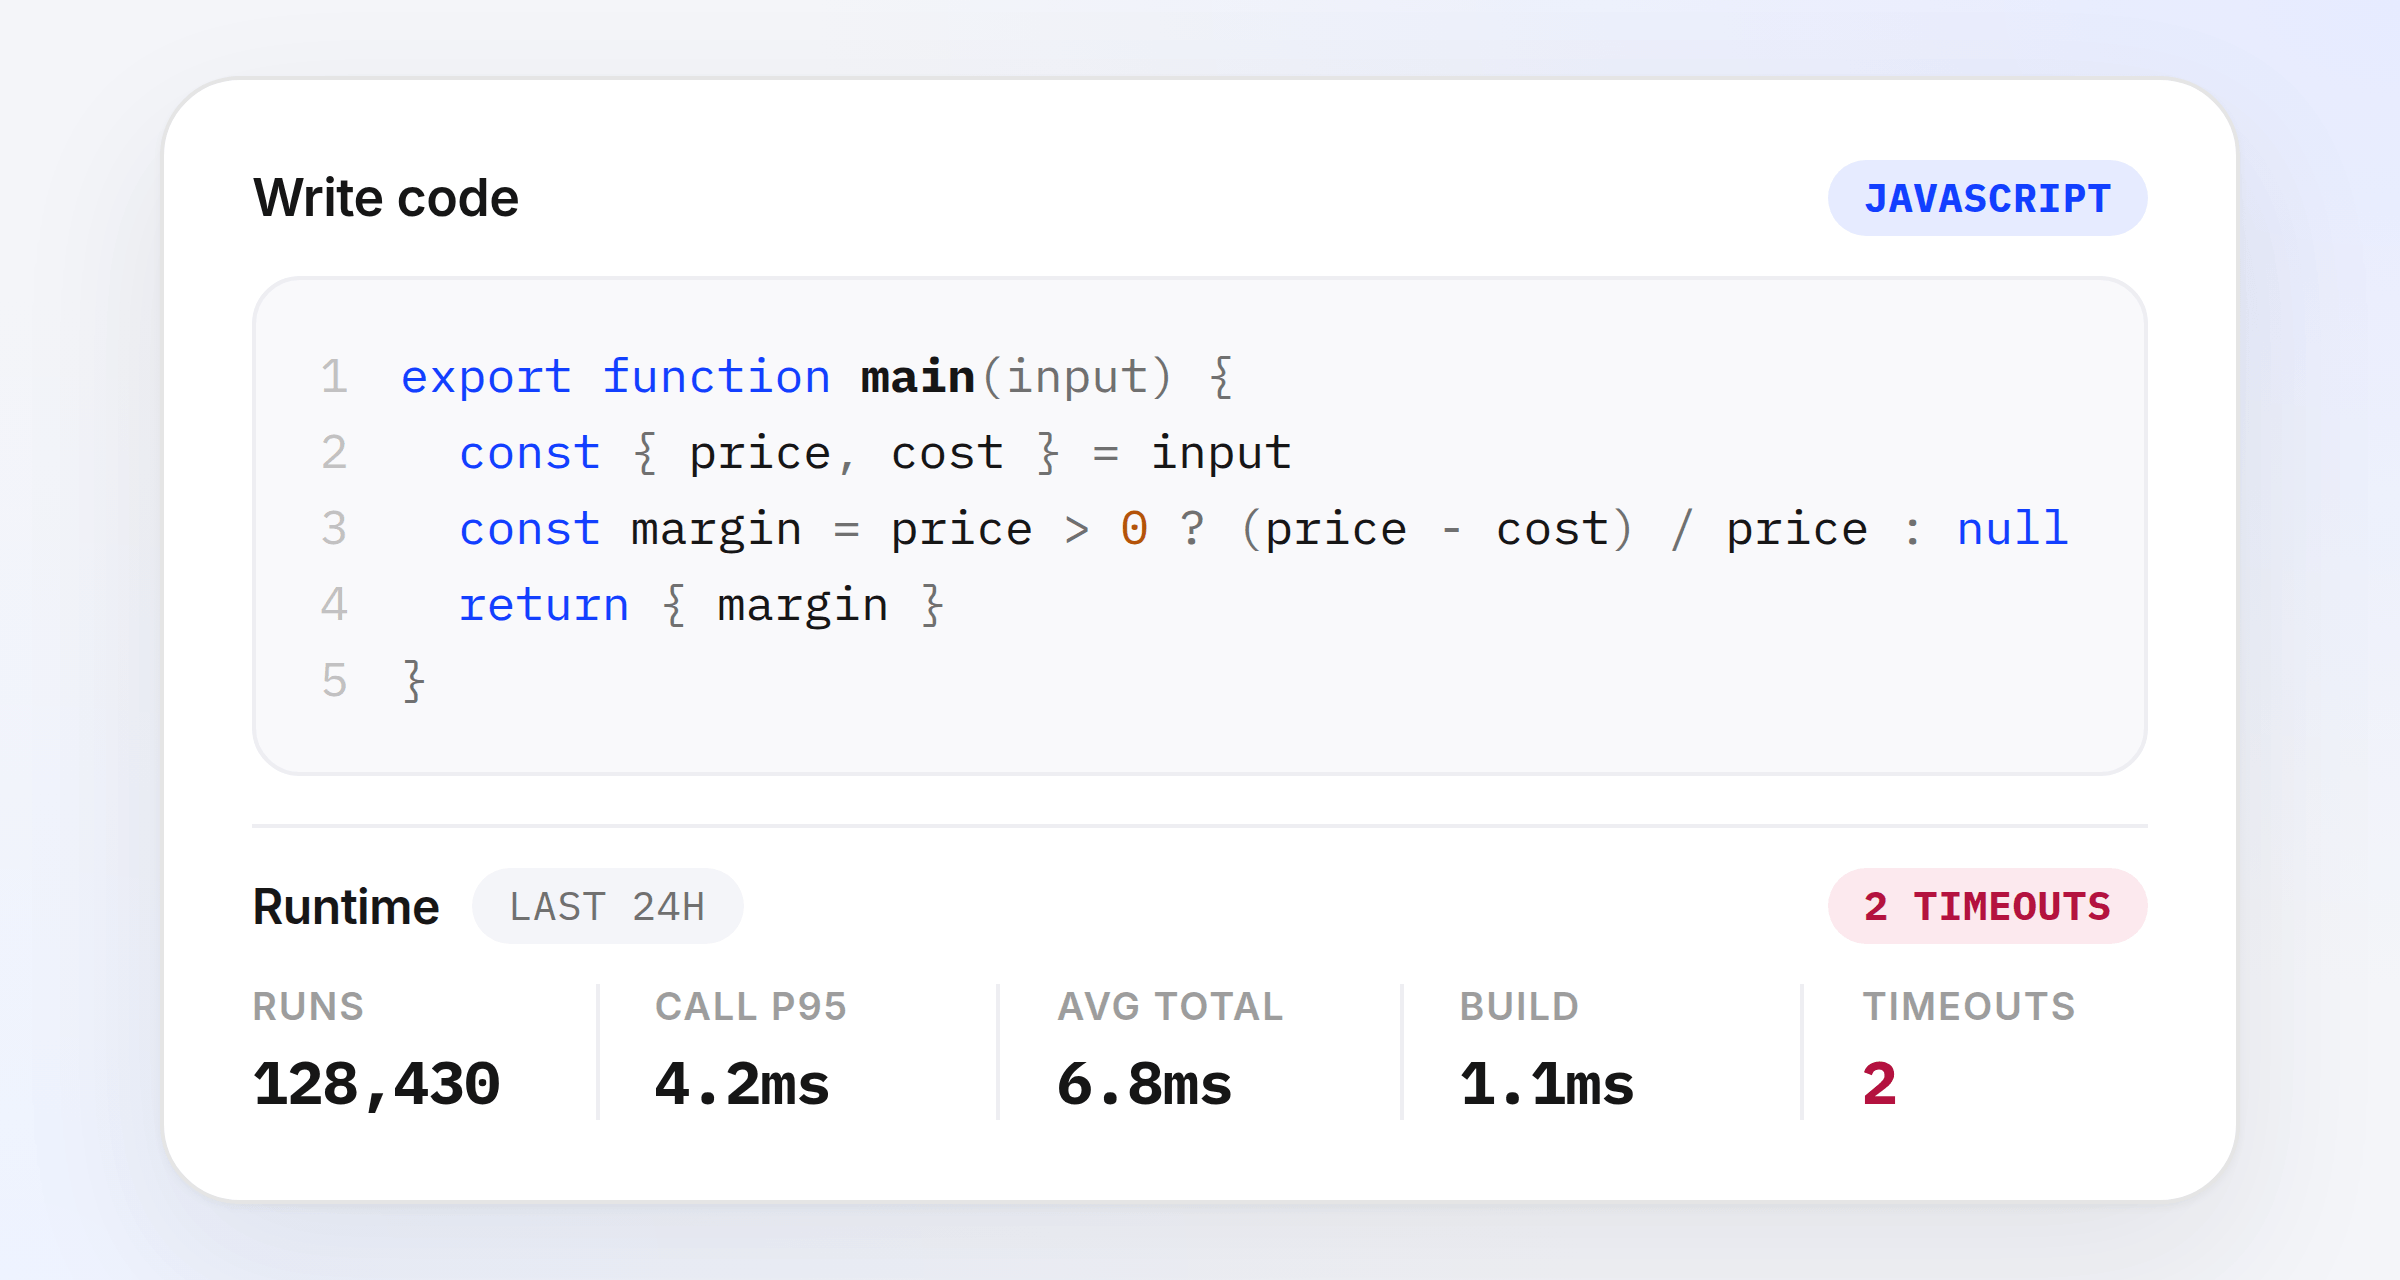
Runtime Statistics for Functions
The Functions editor now shows a Runtime line with per-version execution stats.
See run counts, p95 call time, average total time, and build time for the last 24 hours, or the last 7 days if a Function hasn't run recently.
Timeouts, failures, and retries show up in red, so a slow or broken Function is easy to spot before it affects your catalog.
Each published version tracks its own statistics, so republishing a Function always starts with a clean slate.